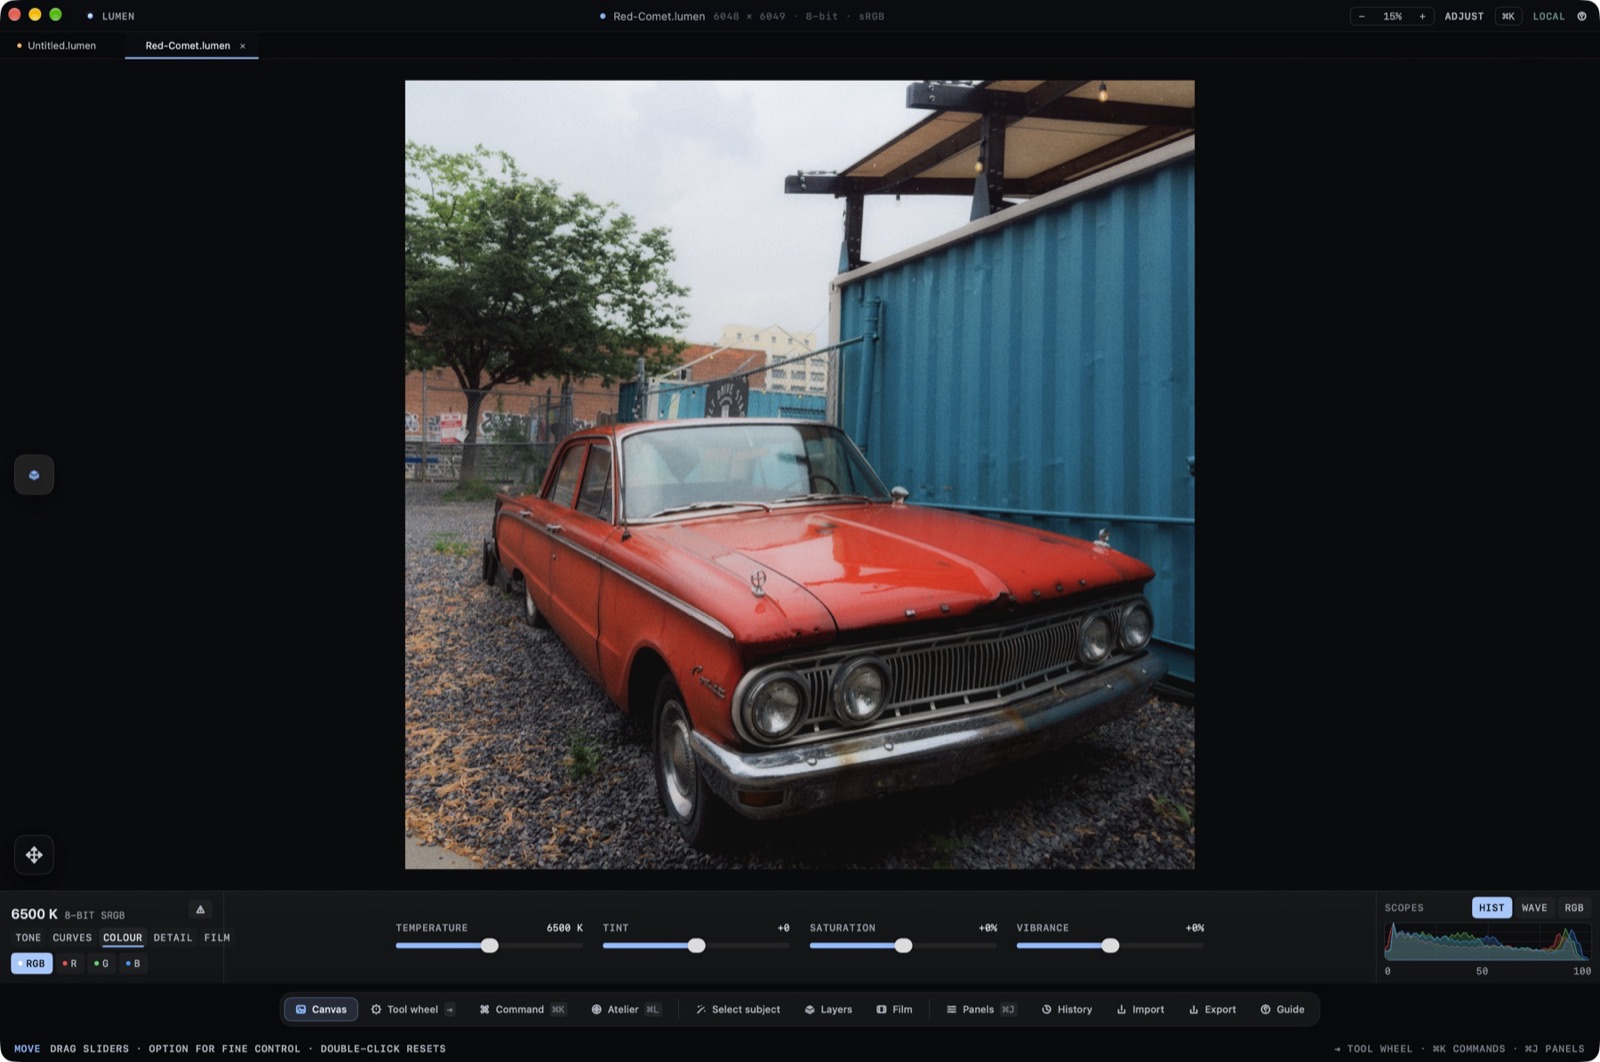
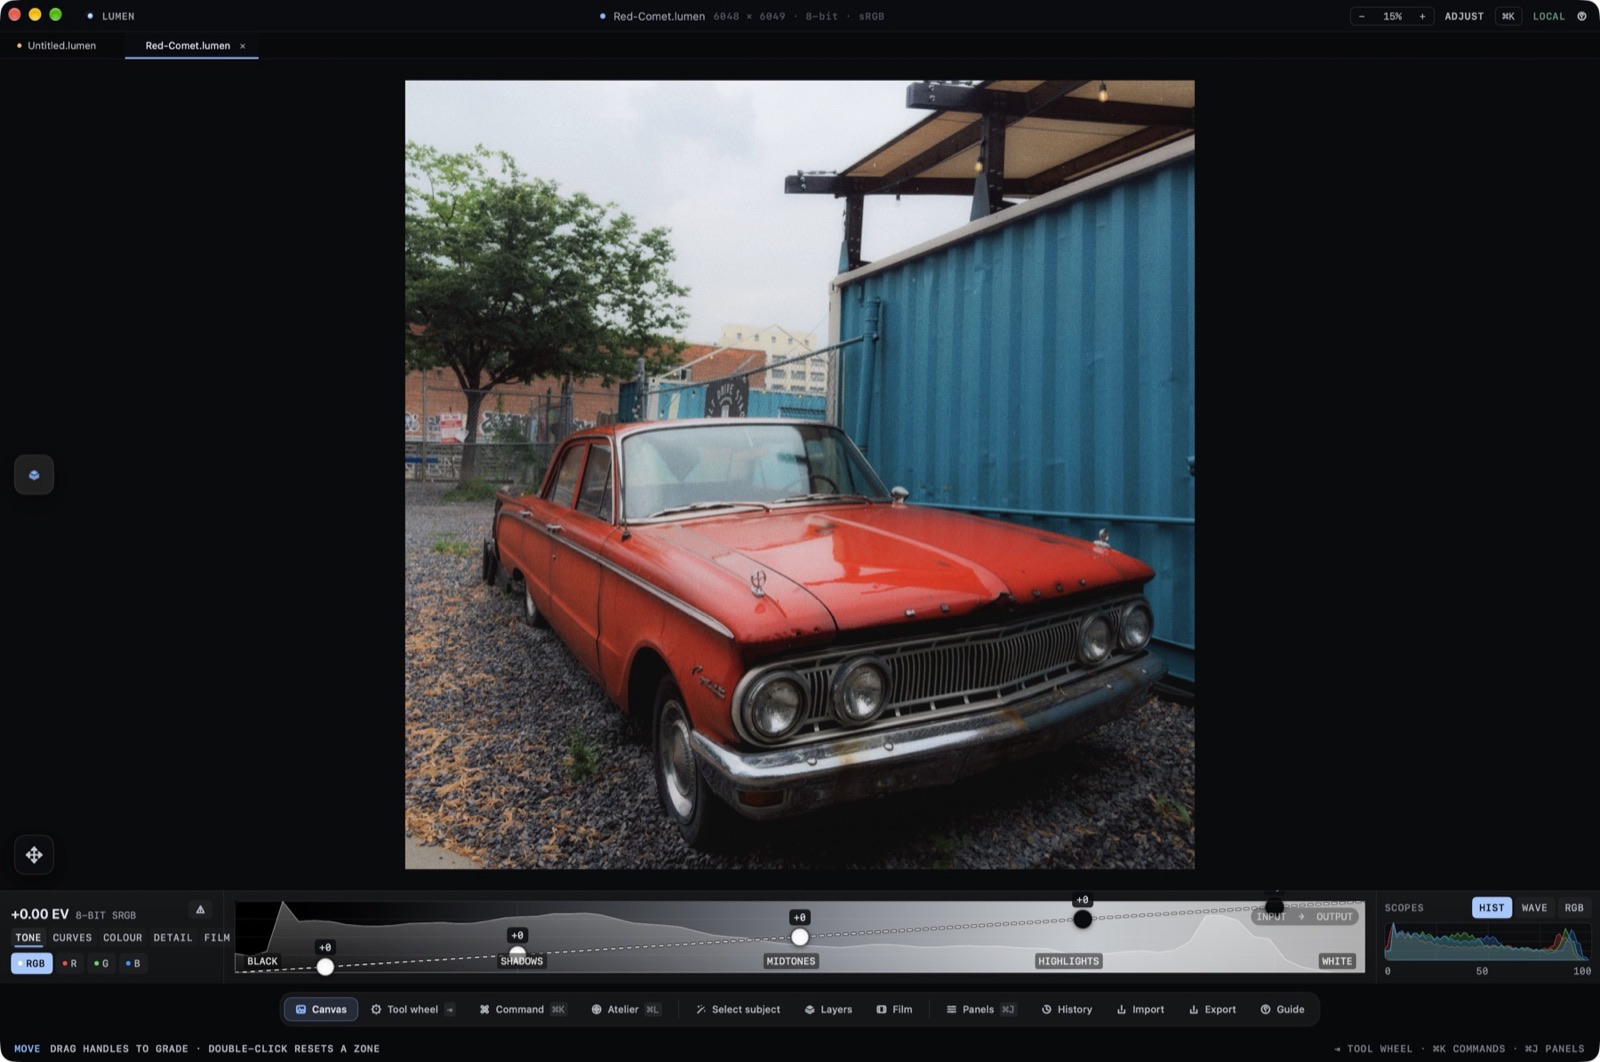
TONE and CURVES share the lower ribbon. The graph is one curve with zone points. Channel buttons switch what that curve drives.
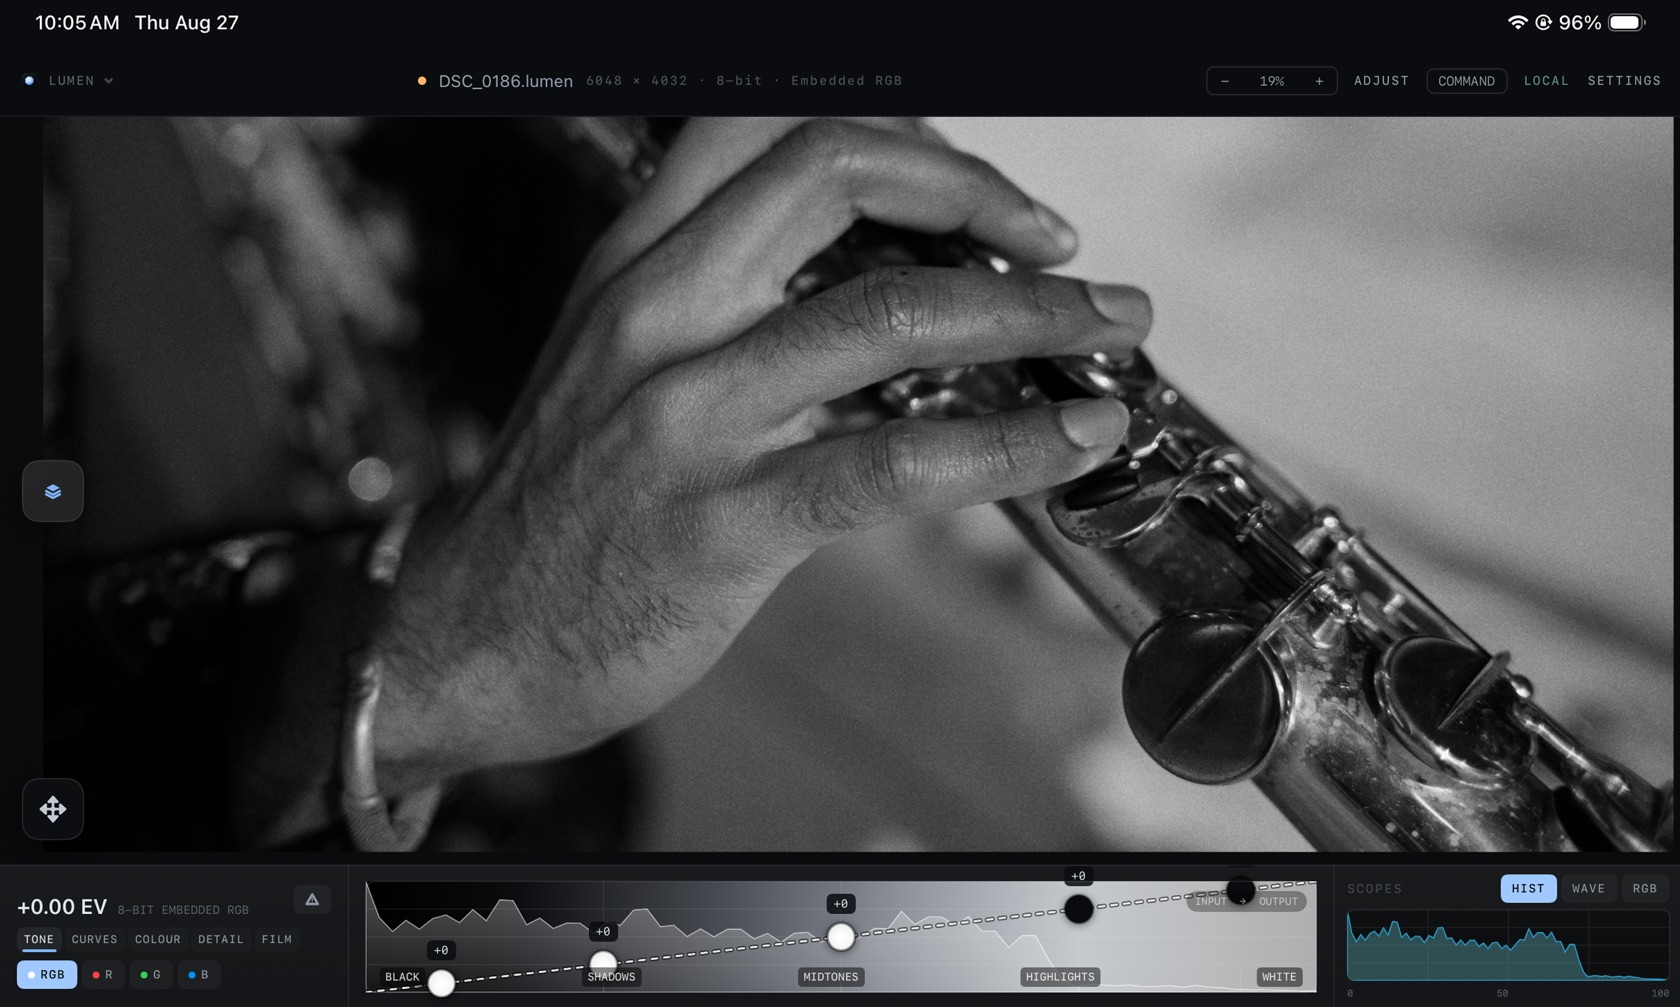
Light & Zone Exposure
On TONE the points are BLACK, SHADOWS, MIDTONES, HIGHLIGHTS, and on the curves graph WHITE as well. Each point shows its offset, such as +0.00. The left of the ribbon shows exposure in EV and the document's bit depth and profile, for example 16-BIT DISPLAY P3 or 8-BIT EMBEDDED RGB.
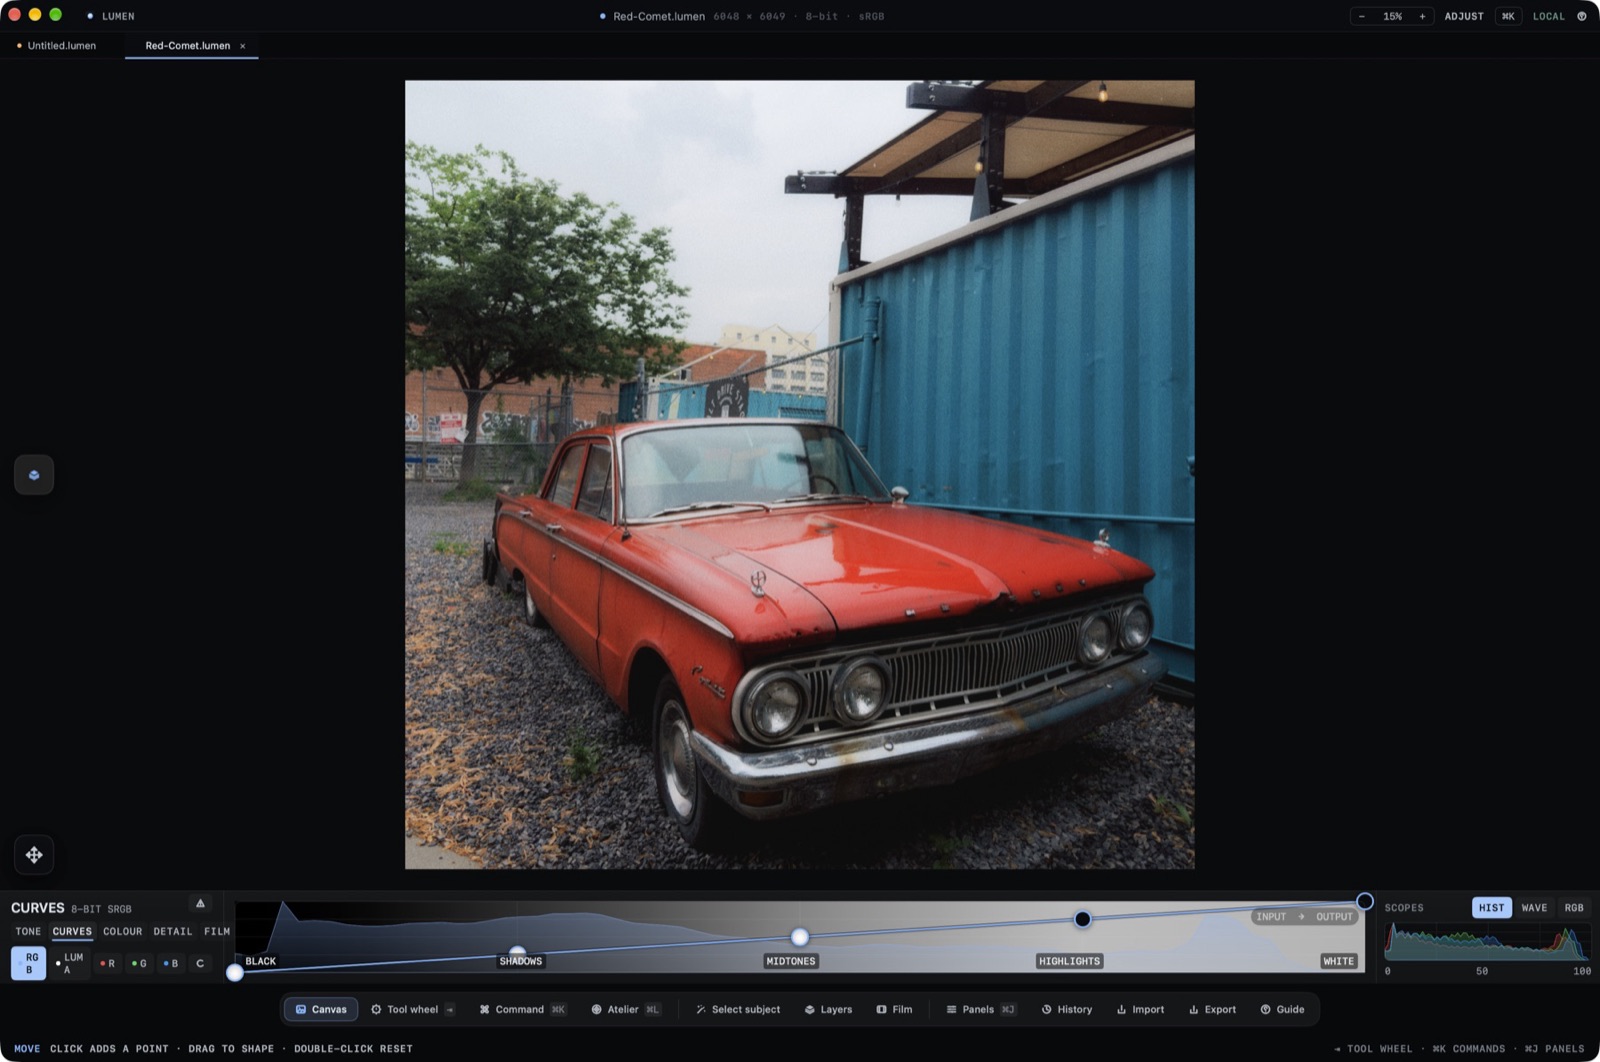
Curves
CURVES uses the same graph. The channel buttons under the groups are RGB, R, G, and B. INPUT and OUTPUT are the two axes of the point you drag. HIST stays visible in the scopes well while you drag.
- RGB
- The combined curve.
- R
- Red channel.
- G
- Green channel.
- B
- Blue channel.
- WHITE
- The right-hand point on the curves graph, past HIGHLIGHTS.
Colour
COLOUR is the next group. The sliders are TEMPERATURE (kelvin), TINT, SATURATION, and VIBRANCE.